2022 Hurricane Forecast for The Bahamas
June marks the official start of hurricane season in the tropical North Atlantic and hurricane forecasters are predicting above-average activity in the North Atlantic Basin this year. Current predictions call for 20 named storms, 10 hurricanes and 5 major hurricanes (Category 3+) over the season, with a 65% chance that a storm will pass over The Caribbean, not including The Bahamas. Increases in sea surface temperatures (SSTs), decreased sea level pressure (SLP) and El Nino Southern Oscillation (ENSO) are all factors that will sustain a higher than normal Accumulated Cyclone Energy (ACE) in the North Atlantic.
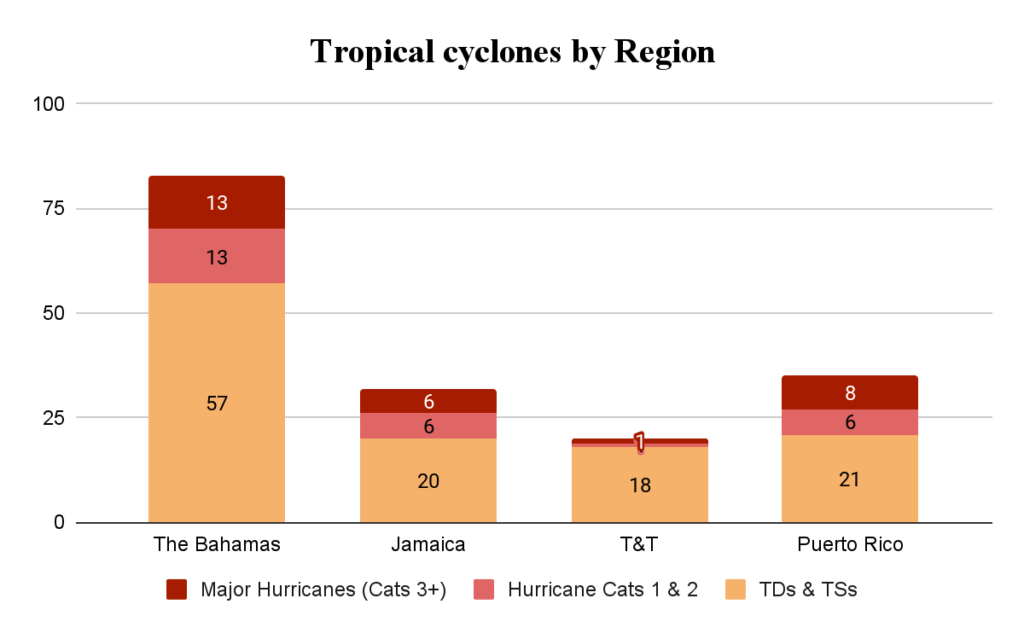
Compared to other Caribbean nations (Jamaica, Trinidad & Tobago and Puerto Rico), The Bahamas has historically experienced the highest number of tropical cyclones, which includes major hurricanes. In the North Atlantic Ocean, tropical storms have four main genesis regions: The Bahamas, the eastern MDR (originates off the African coast near the Cape Verde Islands), the Gulf of Mexico and the Southern or Western Caribbean Sea (Figure 1). Storms are classified by types based on their genesis locations: Bahamas Busters, Cape Verde types, Gulf of Mexico types and Southern/Western Caribbean types, respectively. Cyclones generated in these regions all travel to The Bahamas, but this is not true for other Caribbean nations.
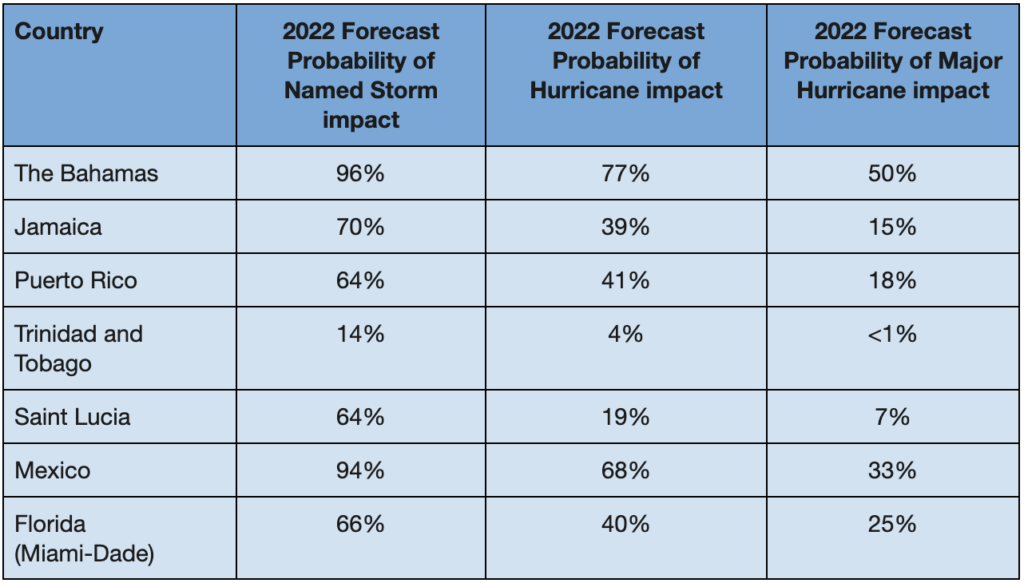
The Bahamas is more likely to experience hurricanes this year than other regions based on its proximity to Florida and the Caribbean (Table 2), both of which’s chances of being hit by a major hurricane this year have increased. This could be related to increased sea-surface temperatures in the region and weaker vertical wind shear (VWS) as a result of the La Niña event this year. Increased sea-surface temperatures can act as a fuel for convective activity in tropical cyclones which can increase energy and therefore intensity. Low sea level pressure is associated with weaker trade winds, and weaker vertical wind shear, which can suppress cyclone development, so the weaker the VWS is, the more intense storms will likely be.
The equatorial Pacific Ocean has been in a negative phase of ENSO, La Niña, since last July. This means that surface water in the equatorial Pacific is cooler than average. In the Pacific, La Niña strengthens trade winds but weakens them in the Atlantic Ocean, which in turn weakens VWS. It also makes the region a little more susceptible to increased humidity and thunderstorm activity. Great conditions for tropical cyclone development! Trends in present data show that as the Atlantic continues to a more La Niña consistent state we will likely experience more hurricanes in the North Atlantic Ocean. At present, La Niña is likely to continue until the end of the year, but it is likely to decrease from July to September and increase slightly after.
In the longer term we will also see the effect of climate change on tropical cyclone intensity. Globally, we expect that with increased surface temperatures and oceanic heat content that storms will become more intense and have more overall precipitation. There may also be evidence of tropical cyclones traveling at slower speeds that may increase rainfall on land. With increased sea levels, more rain and slower cyclone translational speeds, this could be a recipe for more disasters as there will be higher levels of storm surge and flooding.
By comparing 2000-2010 to 2011-2021 changes in the North Atlantic cyclogenesis reasons, we can establish decadal climate changes that may be contributors to more active storm seasons in the next ten years. These changes could infer that there has been an increase in convection as the temperature has increased in these areas where storms generate. In the long term, we may see more active storms become the norm especially if the basic state of the equatorial Pacific settles into a more La Niña-like state.
According to the forecast by the Colorado State University TC research group (Table 1), The Bahamas is 96% likely to be impacted by a named storm (tropical storm to major hurricane) this season. There is a 77% chance that the storm will be a hurricane and a 50% chance that it will be a major hurricane. For other countries and regions near The Bahamas, the chances of impact are relatively lower (except for Mexico, which is also impacted by storms from the East Pacific and has a larger surface area than The Bahamas). With the changes in environmental factors, such as ENSO, SST and mid-tropospheric humidity, The Bahamas will need to consider how much damage it will likely undergo this season as TCs will likely intensify quickly this season.
Climate modeling for small island developing states (SIDS) and smaller gridded regions is a difficult feat for numerical dynamic modeling because of the size of grids in models and the resolution required to properly model all Earth’s processes. One of the difficulties in properly modeling hurricane activity is that there is a missing component of ocean characteristics that contribute to cyclone development and intensification.
The sea glider project at The Island School’s Cape Eleuthera Institute aims to help remediate this by using autonomous drones to measure ocean temperature and salinity, partially when hurricanes travel over them. The gliders that are deployed in a given season will send back observations in real-time via satellite connection that are used to better represent the ocean conditions in NOAA’s operational hurricane models. Ideally, gliders can provide temperature and salinity profiles down to 1000m when there is no hurricane activity and 500m when a hurricane travels over them. This data is sent to the NOAA National Hurricane Center to improve hurricane prediction accuracy in real-time, especially for major hurricanes. By providing this data, we can help save lives with ways to better predict rapid cyclone intensification.
By Marjahn Finlayson
Research Scientist