Why measure Rainfall?
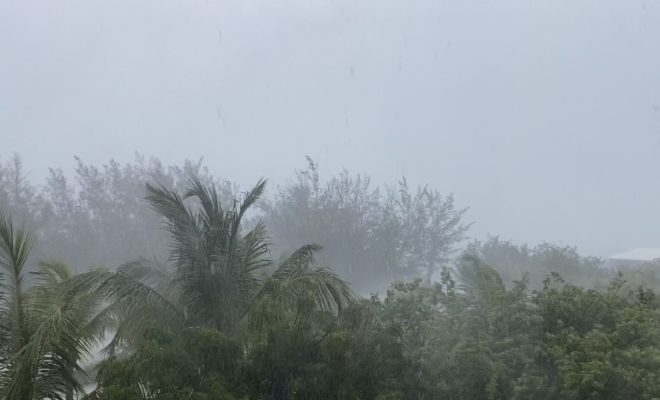
Earlier this month, South Eleuthera experienced a large amount of rain in a short period of time. We’re grateful to break the dry season and begin to receive more rain, and we’re prepared to measure rainfall to see what we can learn.
The Deep Creek Middle School rain gauge collected 7.70 inches of rain between June 5 and 6. Deep Creek experienced some flooding from consistent thunderstorms that weekend that ended up raining out Conch Fest. For context, last autumn when Deep Creek had deep water puddles (on Nov 19 & 20, 2021), the rain gauge collected 5.93 inches. What does this mean?
To get a better idea, we look at the larger picture. According to The Bahamas’ Department of Meteorology, The Bahamas experiences two seasons: a wet season (May to October) and dry season (November to April). Note that the wet season also lines up with the Atlantic Hurricane season (June 1 to November 30). So what does rainfall normally look like in South Eleuthera.
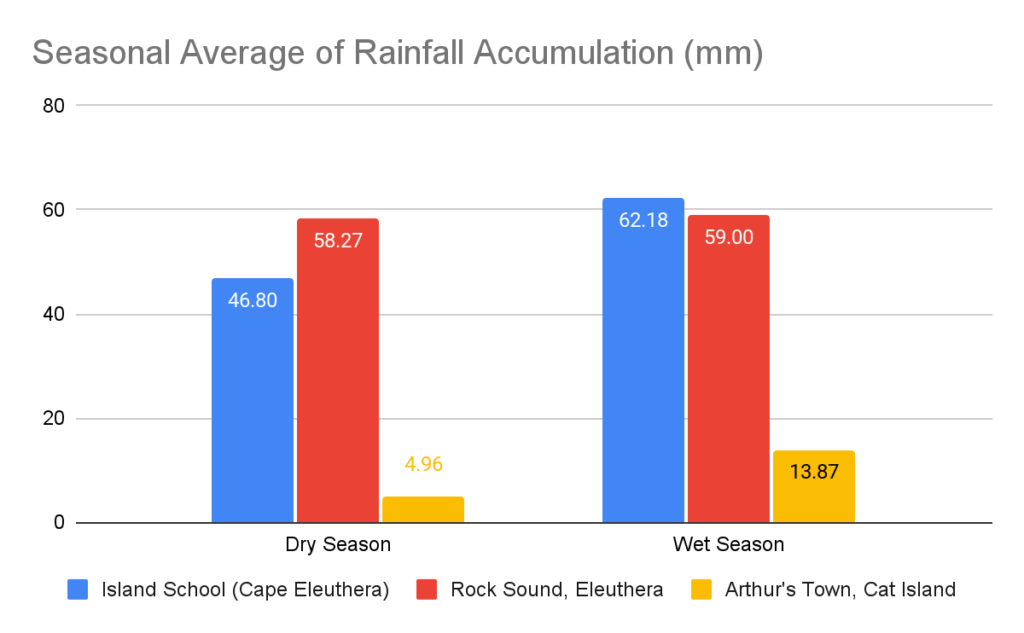
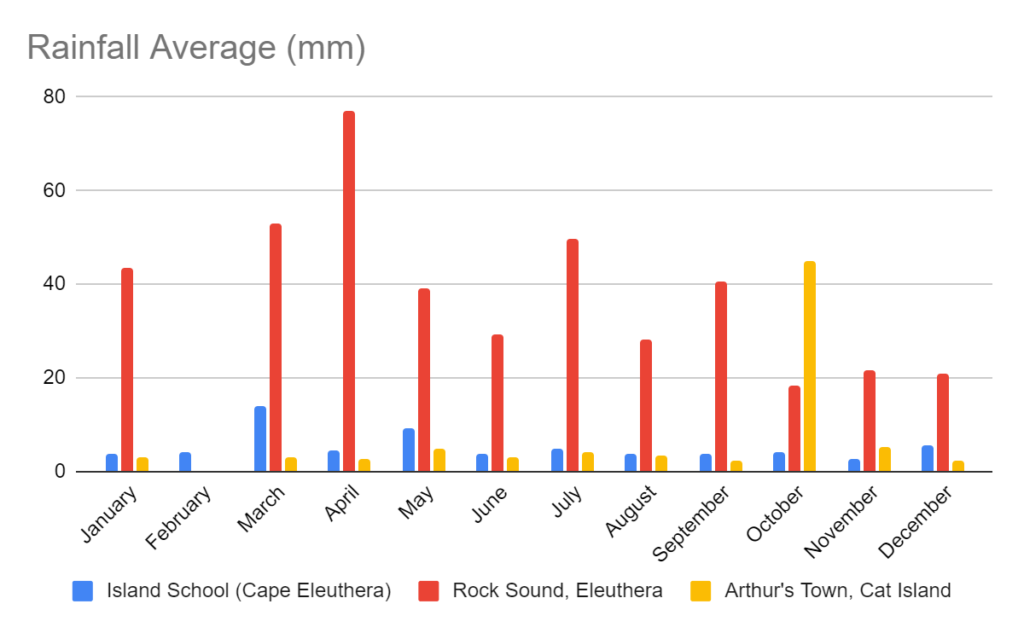
Seasonal rain averages vary across seasons in different settlements in South Eleuthera and Cat Island (Figure 1). Rainfall increases during the wet season for Cape Eleuthera and Arthur’s Town, but not by much for Rock Sound. Deep Creek is close proximity to all regions here so one may assume that rainfall will also increase during the wet season. We have a medium confidence in this data.
In partnership with the Community Collaborative Rain, Hail and Snow (CoCoRaHS) Network, The Island School and One Eleuthera Foundation have rain gauges set up all over South Eleuthera. At The Island School, one rain gauge is set up in Deep Creek and one is coming soon to our campus on the Cape.
Why use a manual rain gauge?
- Though we have an automated weather station, these stations are notorious for making large errors in capturing rain data. Note that in Figure 1, there is a 65% confidence for reasons in the automated rain collection, standard error in data and missing data for time periods.
- Rainfall can be sporadic and many factors can influence it. Rainfall can be sparsely different even in locations that aren’t too far away. This is what led to the formation of the CoCoRaHS Network in Denver, Colorado. They now have rain gauges all over the USA, Canada and The Bahamas.
- Recording these measurements can create a climate report for the area. This can be compared to other regions to establish microclimates and can be compared to different temporal steps to establish a regional pattern.
- Once a climate report is established, researchers can compare present trends to past trends to see if there has been a change in precipitation. Researchers have stated that global precipitation is supposed to increase as a direct result of climate change. Are we seeing those changes at present?
What is a rain gauge?
This is a weather instrument that collects rain and other forms of precipitation. It can measure precipitation in inches or millimetres. It funnels rain into a cylinder for measurement. It is handled manually.
Why measure length instead of volume? It rather measures depth because that’s an easier unit to imagine on a surface. This can help us better understand and prepare for potential flooding as a result of torrential rain.
By Marjahn Finlayson
Research Scientist